✨ New: Timeline View Added!
STOP DIGGING
DEAD FORKS.
Visualize repository history. Free for open source.
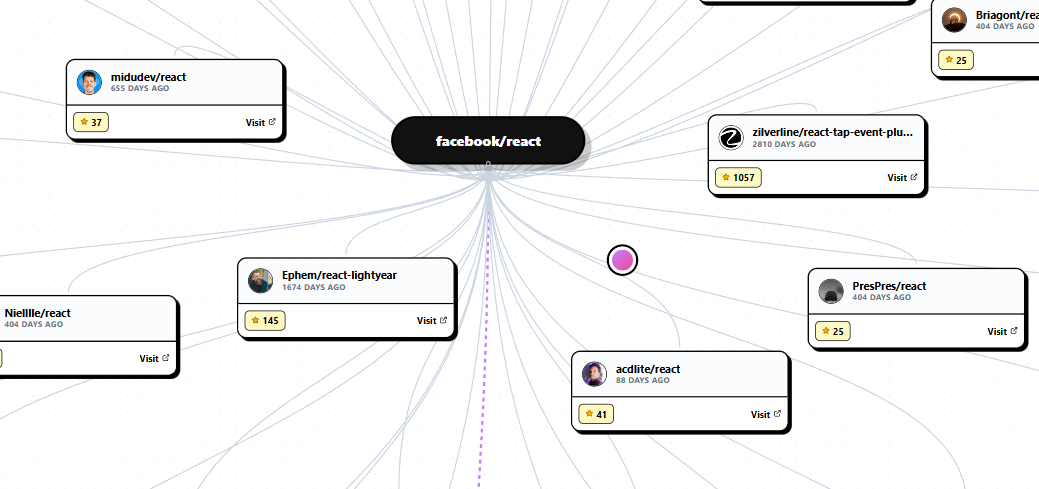
Don't just look.
Interact with it.
Try it right now. This is a live visualization.
- ✓Drag to pan
- ✓Scroll to zoom
- ✓Click nodes to visit
● Live Interaction
Timeline View
See forks arranged by time.
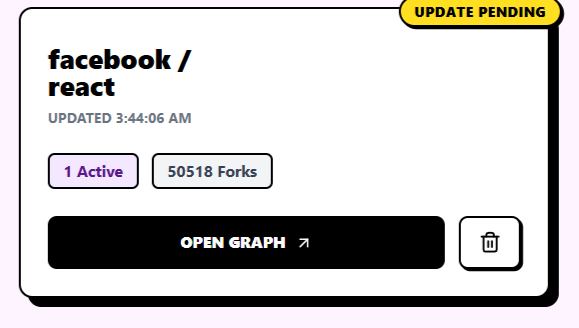
Save & Share
Logged in users can save up to 4 graphs.
Daily Quotas
Smart rate limiting ensures fair usage.
HOW IT WORKS
Three steps to clarity.
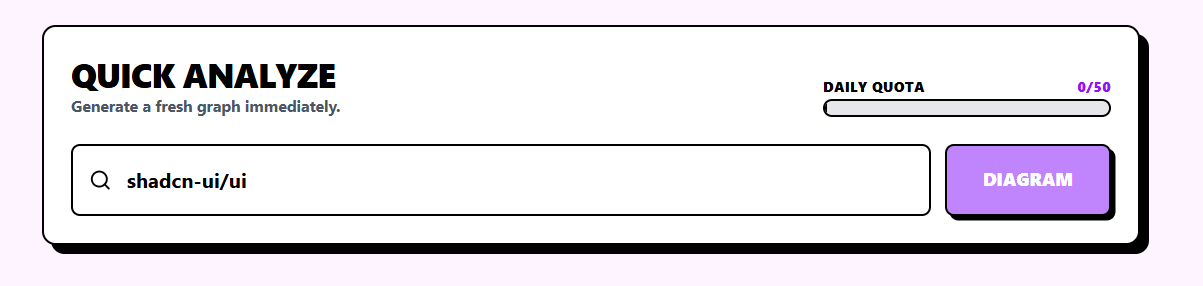
01
Paste & Scout
Drop a GitHub repo link. We instantly map the entire network, visualizing connections hidden in the code.
02
Explore Tree
Zoom into active branches. Identify dead forks and active contributors at a glance with our color-coded heatmap.
03
Save & Flex
Generate a live status badge for your README. Show off your project's health to the world with a single click.
Devs Love ForkLens
"Finally, I can find which fork actually has the feature I need."
Sarah J.
Senior Dev @ Vercel-ish
"The visualization is sick! I put the badge on my repo immediately."
Mike T.
Maintainer
"Stopped me from wasting 3 days on a dead fork. Worth every penny."
Alex R.
Full Stack